The topic of overall equipment effectiveness (OEE) is a perennially hot topic in automation. We see it every month in the traffic search data that leads users to the automationworld.com site. Considering that OEE is a straightforward and decades-old formula, the number of searches being conducted about OEE indicate that workers in industry still have lots of questions about how to use it.
To address those questions, we connected with Jim Toman, senior manufacturing execution system advisor with system integrator Grantek, for a recent episode in the Automation World Gets Your Questions Answered podcast series.
In that discussion, Toman provided an example of how to calculate OEE for a standard manufacturing line. His example focused on a single production line that included filling, wrapping, sealing, weighing and cartoning of a food product.
“So what we would basically do [for a line like this] is measure how many packs we fill in a shift, how many were rejected for quality issues, and how much time the line was running versus being down or stopped,” he said. “We won’t take into account things like changeover or cleaning time. There's a lot of complexity you can add, but for simplicity we'll ignore those for right now and we'll look at the OEE for the line as a whole.”
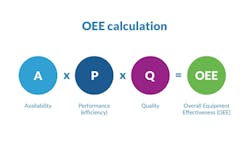
To get the OEE availability percentage, Toman said to take the number of minutes that the machine or line was running divided by the total minutes available for the shift minus the cleaning and change over time to simplify this example.
“Let's say that the line was down for equipment issues for a couple of hours in an eight-hour scheduled run. That gives us eight hours of time available. We had two hours down. That means our availability was 75%.”
For the OEE performance percentage, Toman said to take the ideal cycle time of the filler, multiply that by the total number of packs filled and divide it by the running time. In this case, we’ll say the line ran at full speed the entire shift when it was operating, so performance would be 100%.
To get the OEE quality percentage, Toman said take the number of packages that were rejected for quality issues and subtract that from the number of total packages. That tells you how many good packages were made.
“We would divide that by the total packs, so if we lost 50 out of 1,000 packs, our quality number in this case is 95%,” explained Toman.
That's basically how you get each of the components of OEE. Take 75% for availability, multiply that by 100% for performance and multiply that by 95% for quality, which would give you an OEE of 71% for that shift.
OEE application
Having this kind of insight into production is certainly helpful, but how do you then apply the OEE results to achieve a quantifiable impact or an improvement in production operations?
To answer this, Toman noted the top three ways he’s seen this done effectively.
“One is that it's commonly used as a success measure. So when companies are doing this, they're working to compare one operation versus another—either line to line, shift to shift or plant to plant. It allows managers to understand where the operation is performing better in one situation versus another or which particular product is better to place in an area that better handles higher volume versus one that doesn't,” said Toman.
He added that this approach can also be used to plan production schedules based on past performance history so that the manufacturer can make more reliable commitments to customers and/or incentivize production teams.
For example, you can show the production team what their OEE number is over the course of a shift so that they know whether they're ahead or behind meeting the target they're meant to meet.
This approach can also serve as a sort of “canary in the coal mine for equipment performance issues,” said Toman. “As you’re looking at OEE trends, you can see that the OEE results started at one number and is degrading, indicating a negative trend and notifying you to investigate underlying data to try to understand what kind of issues might be developing on that equipment. I see this a lot where highly mechanized equipment is used. For example, we’ll see increasingly lower speeds on the equipment that results in a lower throughput. When this is seen, an investigation needs to be done to find out if a belt needs to be replaced or preventive maintenance needs to be done to prevent a breakdown. You can make measurable changes to your overall production performance if you keep an eye on these things and get ahead of problems as you see them starting to develop.”
According to Toman, another good application of OEE data is as an enabler for continuous improvement. Here, data from a particular shift or a production run is made available on a production report at a daily, weekly or monthly meeting. This OEE data review will highlight where issues occurred, such as when not as much product was made as was expected or where breakdowns occurred.
“The most effective use of this kind of OEE data review is when a company takes that information and applies it as part of their general continuous improvement process by applying Lean 6 Sigma principles to it,” said Toman. “Maybe they'll do a five whys investigation or a fishbone analysis. If there was a particular set of incidents that happened over and over again, they'll figure out how to address the problem points, make a change and then use OEE to verify if the change had the benefit they were expecting.”


