The Power Law: Where Quality and Probability Meet
I ran across a blog post recently from James Mok, director of solution strategy and business development at Apriso (a supplier of MES and supply chain software). In his post, Mok discussed how recent tragic events such as the Boston Marathon bombing and the Sichuan earthquake in China can be connected with the Cost of Quality (CoQ) at a manufacturing company through a statistical rule called the Power Law.
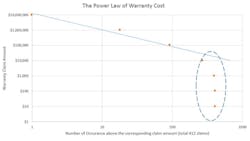
In essence, Mok says that plotting the logarithm of the magnitude of an event against the logarithm of the probability that event will occur results in a straight line with a negative slope relationship. As for how these events can be connected with CoQ, consider the graphic accompanying this article (in the photo box at top right), which is an analysis of the warranty claim data of an Automotive Tier 1 supplier within the period of one year.
According to Mok, this data set indicates that claims above $10,000 follow the Power Law very closely. The circled area shows that smaller claims, likely indicating smaller sized defects that skipped the system, have a lower occurrence. “Assuming these data are representative patterns, they are showing that the power constant is approximately equal to -1. This means that the occurrence of claims above $100,000 is about 100 cases in a year; those above $1 million are about 10 cases a year; and those above $10 million occur about once a year,” Mok says.
Studies on terror events have found that very similar relationships exist between casualty and the probability of occurrence, Mok points out. The power constant for terrorism is found to be about -2.5. In other words, the occurrence of a 200 casualty event, such as the Boston bombing, is approximately 10^2.5 = 316 times more likely than a casualty 2,000 and above event, such as the Sept 11 attack on the World Trade Center in New York.
Quality events follow similar patterns to those suggested by the Power Law through supply chain connections. Among these connections are:
• Interdependency—Supply chain elements are highly interdependent. For example, Mok notes an instance where a small crack was discovered in a critical glass furnace at a remote factory in Japan. As a sole producer of glass substrate for storage media in magnetic drives, the crack disrupted the entire server and PC supply chain for days, costing manufacturers millions of dollars.
• Positive feedback—Public awareness can distort the actual cost or danger of a defect. A now famous example is Toyota‘s ‘unintended acceleration’ case, which ended up being settled by Toyota for $1.1 billion dollars. When Toyota identified a potential root cause to be floor mats made by certain suppliers, the number of reports increased exponentially and the publicity of the case became a media frenzy.
Looking to Power Law behavior to improve CoQ can be problematic for manufacturers because it differs a great deal from Six Sigma, which has a foundation based on a normal distribution or the Bell curve. Mok says two critical differences between Six Sigma quality practices and Power Law CoQ include:
• The meaningless in discussing the average size of a warranty claim because the shape of the Power distribution has no mean or standard deviation (sigma);
• The most important data points are outliers. “In our data set, the top 10 claims among all 412 claims contributed to more than 50 percent of total warranty cost, but these large claims were outliners typically ignored by Six Sigma methodology,” Mok says.
Considering what the Power Law data tells us, Mok says that traditional quality management systems “might not be enough to prevent quality defects when the Power Law is in effect. Therefore, a different strategy is needed that involves three major steps. The first is to enable detailed product traceability across the interdependency of the supply chain. Once this has been established, the second step would be to build an early warning system, perhaps based on “big data” enterprise manufacturing intelligence, which establishes granular traceability across the value chain. The third step is to tie such warning signals to a series of actions that involves the PDCA (Plan Do Check Act) cycle as well as a containment strategy.”
Another hitch for advocates of integrating the Power Law into CoQ processes will be return on investment (ROI) calculations. “Traditional ROI analysis on annual return can rarely be used to justify investment to implement such strategies and solutions,” Mok says.
In my experience with many manufacturers, the difficulty in establishing ROI for this approach will likely relegate the Power Law and its connection to quality to the back burner on a stove in someone else’s house. In other words: completely off the radar. But when it comes to manufacturing strategy, one must realize that ignoring outlying, yet likely events does not constitute an effective business strategy.
About the Author
David Greenfield, editor in chief
Editor in Chief

Leaders relevant to this article:

