Death by a Thousand Spreadsheets: The Simple Yet Insidious Nature of Time Series Data
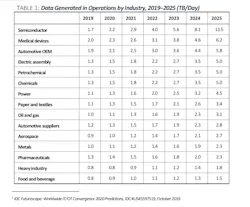
In the mid-1970s, the process manufacturing industry began its transition to digital infrastructure with the first distributed control system, and this trend accelerated in the 1980s with the proliferation of supervisory control and data acquisition and human-machine interface systems. Equipped with sensors, digital networks, and programmable logic controllers, companies began generating and collecting massive amounts of data from their operations. And now, 30+ years later, process manufacturing companies generate terabytes of data—1TB/day for the average plant and perhaps 40TB/day for a corporation with multiple plants (see Figure 1)—recording flow, temperature, pressure, level, and everything in between.
This sensor data, technically “time series data,” is the starting point for all analysis and optimization efforts in process manufacturing. However, analyzing time series data is as complex as it is critical, leaving many organizations mired in a web of Excel spreadsheets.
The concept of time series data is simple: the measurement of physical world over a period of time stored as a data pair—timestamp: value. But that only scratches the surface. In process manufacturing plants, tens of thousands of sensors are measuring the world at different intervals on any given day. Companies must be able to analyze all of this data to discover relationships, investigate issues, optimize production, and predict outcomes to prevent catastrophic failures (Figure 2).
In addition, organizations use time series data to support broader business objectives. Given the rate of change in process manufacturing, all of this must happen quickly if the analytics are to improve operations in a timely manner. And that’s where time series data suddenly becomes very, very complicated.
Time series data storage
Time series data is typically stored in dedicated applications, such as process, data, or enterprise historians. The data may be viewed in “trenders,” which are applications for visual analytics, or copied into spreadsheets for calculation-based analytics. While organizations benefit from consolidating relational data to enable new and more complex relationships and correlations, time series data doesn’t enable better insights simply because it’s aggregated in one place: user input is required!
This is because calculation analytics with time series data depends on the user to define the critical time periods of interest and relevant context—all at the moment of analysis. This is why spreadsheets, as time consuming and cumbersome as they are, are still the time series tool of choice for engineers to perform ad hoc analytics. They put the user in control of the questions and investigation, while offering a known path of analysis.
However, spreadsheets bring a new host of issues. Collaboration is difficult as is version control, and new queries must be run as data changes. Data cleansing and contextualization is a slow and manual process. What one person does on their desktop may not be discoverable by their colleagues. And the basic issues of time series data, like time zones, daylight savings time, and interpolation types and logic, must be addressed by the user in spreadsheet formulas. The result isn’t just hours in spreadsheet hell, it’s weeks or months.
Furthermore, time series data is difficult to reconcile and analyze in the broader business context necessary for profitability and efficiency use cases to succeed. Traditional business intelligence (BI) applications are great for relational data sets, but they don’t accommodate the dynamic nature of time series data. And data scientists can’t run their algorithms until data is “ready,” which means they must first assemble models of cleansed, calculated, and contextualized time series data. For all their expertise in algorithms, data scientists don’t have the plant, asset, or process expertise to know what they are looking for in the data. This is why process engineers, subject matter experts with first principles expertise, are required for the data preparation efforts for both business analyst and data science tasks, as well as for process-related analytics.
Regardless of the complexities, time series data is critical for innovation and for achieving business goals. Leveraging time series data to augment and drive deeper context and meaning for process engineers and traditional BI applications is the correct path, but today most analyses begin at the same starting point: the spreadsheet.
Making use of data insights
So how do process engineers and data scientists quickly get the insights they need and collaborate for a better, more optimized future? This is where Seeq advanced analytics software comes in (Figure 3).
Advanced analytics software is as easy to use as time series data is labor-intensive to analyze, enabling process engineers and subject matter experts to cleanse, contextualize, and model operational data to quickly find the right insights and make data-based decisions. Data is accessed across silos, is never copied or duplicated, and is used for diagnostic, predictive, and descriptive analytics.
Advanced analytics software empowers collaboration among colleagues with published reports and dashboards for insights across the organization. All without rifling through hundreds of thousands of rows in spreadsheets. With advanced analytics software, it’s possible to quickly get the insights organizations need to realize the full value of time series data.
So, for the process engineers doing their own analytics—or preparing time series data for business analytics using PowerBI, Tableau, or other BI applications, or for data scientists using their machine learning algorithms—advanced analytics software taps innovation in data science to catch up to the volume and challenges of efficient analytics with time series data. And for those of you who don’t want to give up spreadsheets with their pivot tables and graphing? Seeq has excellent integration with Microsoft Excel, including streaming updates via OData to bridge from calculation to visualization analytics.
With advanced analytics software, time series data finally is as easy to analyze as it is to create.
About the Author
Michael Risse
Chief marketing officer, Seeq

Leaders relevant to this article: