Well-known as a formula to determine overall equipment effectiveness (OEE) based on equipment availability, equipment performance, and product quality data, the OEE metric has received a lot of attention on its own and as part of continuous improvement programs. For example, it has been used in Six Sigma programs to help target and prioritize areas for improvement. While its popularity over the years has risen and fallen, it continues to be a highly relied upon metric to identify production problems, particularly in the discrete and batch manufacturing industries.
Some industry professionals see a broader application for OEE based on the value of the insights it can provide. OEEsystems International is one company promoting the use of OEE for its traditional plant floor applications as well as for higher-level applications in finance.

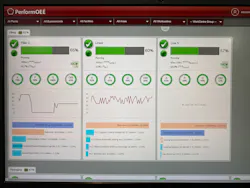
Rice noted that industry’s push toward digital transformation has been a major driver in interest around OEEsystems’ PerformOEE Smart Factory Software and how OEE can be used to transform manufacturing businesses.
For example, financial dashboards and analytics provided by the software allows for linking CapEx to realistic OEE improvement, according to Rice. With PerformOEE, users can “measure the factual base point against improvements and monitor gains on an ongoing basis,” he said. “Pareto charts generated by the software illustrate to the business which costs are associated with all losses. This helps executives understand the value of even a 1% OEE improvement across a machine, line, and process as well as how it can be attributed to the entire business. It also helps users develop more accurate ROI timelines.”
Jim Huysentruyt, project manager at OEEsystems, explained that data used by the PerformOEE software is collected from PLCs via OPC UA. The software “directs operators as to what needs to be fixed—either equipment or operating processes,” he said. “The Pareto charts [in the software] show users what’s happening with downtime, scheduling, breaks, equipment turnarounds, and setup.”
The software runs on a server that can be located on a machine at the edge or in the cloud, said Huysentruyt; and it can interface with SAP or other enterprise system to deliver analysis to executives.
Huysentruyt added that, once the Perform OEE software is installed, OEESystems trains users on what it calls the “Science of Manufacturing”—a set of principles combining technical innovation with a focus on people and culture to deliver successful continuous improvement programs.
Key functions of PerformOEE include:
- Automating data logging—including downtime—to remove manual recording of shift information.
- Allowing for opening and closing preventative and corrective actions as well as reassigning downtime root causes based on insights gained from operations.
- Enabling collaboration among team members in shift logs to raise corrective and preventative actions. Issues can be escalated within and across shifts.
- Making data reviewable at shift changeover and for daily production reviews.
- Providing real time quality information and alerts (such as rejects and alarms).
- Categorizing data collected by reason and function to feed analytical and trend reports.
- Tracking and setting alerts based on user-defined quality rules for continuous process control.
About the Author


Leaders relevant to this article: