OEE as a Tool for Continuous Improvement

Fueled by the proliferation of industrial data and push for data-driven business practices, OEE (overall equipment effectiveness) remains a core manufacturing metric given its ability to boil complex production problems down to relatively simple terms and drive continuous improvement.
OEE, which can be used to evaluate a single machine, an entire line, or a complete factory, is a relatively simple equation based on three factors: Equipment availability—specifically run-time divided by planned production time for that specific asset, performance—the ideal cycle time multiplied by total product/part count divided by run time, and quality—established by the good count divided by total count. The goal of OEE is to improve efficiency, reduce downtime and operating expenses, and minimize waste.
Calculating OEE as an ongoing best practice gives manufacturers a reality check on production planning and business expectations based on what equipment is actually doing as opposed to presumptions about what it’s supposed to be doing. As a result, OEE remains a top-three metric for manufacturers, according to LNS Research’s 2020 Analytics That Matter survey conducted in partnership with MESA International. More than half (54%) of analytics leaders said they are tracking OEE, which puts it behind only net profit margin tracking (63%) and on-time delivery tracking (68%), the survey found.
“OEE is an easy metric to start with as it doesn’t require downtime, it’s not mission critical, and it isn’t going to break your line,” says Chris McLaughlin, director of sales and marketing for Vertech, a systems integrator specializing in industrial automation. “It’s also easy to prove ROI (return on investment) as it creates a baseline for continuous improvement, highlighting how much production has improved and how much efficiency you’ve gained.”
Measuring OEE was once a manual exercise, but more recently OEE functionality has found its way into MES software as well as control systems, SCADA platforms, and edge computing devices. Advances in plant floor connectivity and increased availability of real-time data through Industrial Internet of Things (IIoT) platforms is putting a fresh face on OEE by expanding access to real-time and enterprise system data that can deliver additional context and insights to improve OEE scores.
“Companies are trying to take it further upstream and downstream and integrate with other systems to take more into account,” says McLaughlin. “The more information you can get from ERP and other systems, the more you improve an ability to do continuous improvement because you understand what is really behind why something is unavailable or performing poorly.”
“There are a variety of reasons a machine isn’t producing the amount we need it to,” says Scott Corbett, Hunter Industries senior manager of operations technology and training. “OEE is the best method to figure that out and maximize machine output.”
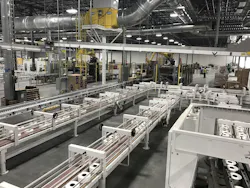
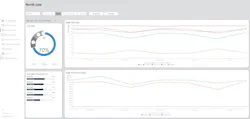
Hunter Industries mostly conducts OEE at a machine or line level to advance both long-term and real-time performance goals. The company fuels its OEE calculations with real-time data from PLCs using a mix of automated and manual methods. The results are regularly served up to employees via visual dashboards on the plant floor, enabling them to monitor issues and make essential adjustments.
“You don’t know if a machine running tooling is a half a second slower than it’s supposed to be running without a real-time monitoring system,” Corbett explains. “Real-time OEE performance is extremely beneficial in a high-volume molding operation to produce the right amount of parts.”
OEE also delivers valuable trending data for Hunter Industries to evaluate subtle losses and gains over time while providing measurable performance targets that can be harnessed to drive progress. “It helps to have something that can compile data for short or long periods of time so engineers can stay on top of putting out fires as well as making long-term progress on process improvement projects,” Corbett says.
As part of its core KPI (key performance indicator) portfolio for the last 15 years, OEE is reported per shift and once daily drawing from Saint Gobain Sekurit’s MES system along with some manual data entry. Sebastien Thuillier, Saint Gobain Sekurit’s digital transformation manager, says the company recently advanced its OEE reporting using Litmus’ edge data platform to automate data collection and allow anyone from any location to check in on the performance of key manufacturing lines. In fact, OEE metrics are not only used by plant floor personnel at Saint Gobain Sekurit; it also informs managers in logistics, supply chain, and maintenance operations to help them focus on continuous improvement, whether that involves adjustments to spare parts inventory or addressing reliability issues.
Automating OEE ensures data is collected in a standard way across equipment and made available to any system, which takes the burden off plant floor operators and reduces the potential for miscommunication.
Of course, the ability to apply live monitoring to production operations doesn’t necessarily advance OEE reporting, but it does mean Saint Gobain Sekurit personnel are alerted to problems quicker, enabling them to respond faster and even anticipate issues in some cases. In the end, corrective action translates into a better OEE score.
“The system enables us to more quickly react to decrease downtime and address issues if a line stopped because there are no more raw materials or it’s missing an operator,” Thuillier explains.

As part of an end-to-end automation initiative to enable cloud-connected manufacturing, put in motion through a collaboration with Amazon Web Services (AWS) and the University of California, Berkeley, Glidewell has made OEE a best practice to ensure high-quality production with the support of Beckhoff Automation’s industrial PCs and TwinCAT3 automation platform. Glidewell calculates OEE every 15 minutes at the machine level to extrapolate the data for the entire production line.
The micro-level OEE calculation helps evaluate how many parts are rejected against whether a machine is down because it produced too many parts or it’s running at too high a calibration. Calculating OEE at this level is particularly important to ensure the automated production workflow runs smoothly on two lines pumping out 2,000 units daily without sacrificing quality of output.
“Our process is highly statistical and the parts we mill are very fragile,” says Kunal Patil, manager of automation engineering for Glidewell. “Any bit of wear on the tools can generate inconsistencies on the part and any tiny bit of calibration change alters the performance of the machines.”
Prior to calculating OEE, there would be a lot of finger pointing and blame games in the event of a problem or if target numbers were missed because there was no benchmark to measure against and no insight into why a specific machine was down. “Now that we have OEE, we know exactly which machine or part is not producing,” Patil says. “It’s a high-level metric that tells people whether they’re losing their time or opportunity because of unavailability, performance, or quality.”
OEE’s simple terms also make it clear which group is responsible for addressing an issue. “If we lost an opportunity because of performance, that’s something the engineering group has to work on, if it’s due to availability, that’s a different group,” he explains. “It provides a common language where everyone understands what to fix.”
Plant performance comparisons
At Cascades Canada, an organization with more
than 70 paper and pulp plants, OEE has been a
long-standing metric that everyone in the company
takes seriously.
OEE calculations are regularly performed at the individual machine and line level, but the metric is also used at the plant level to drive continuous improvement and keep its multiple sites striving toward the same business goals. To ensure the application of this focus, Cascades Canada has cultivated a culture of OEE by establishing a Center of Excellence (CoE) and indoctrinating employees at every level in the importance of a strong OEE score and how the metric and relevant data can inform action to drive continuous improvement.
“All the KPIs are made available through the Microsoft Power BI platform to be accessible for everyone from the president of the company to the mill manager,” says Claude Bedard, project director/ CoE Maintenance and Reliability. “If you have two consecutive days of bad OEE, you fully expect to get a call from the boss asking about what’s happening and what the action plan is to fi x it.”
Cascades manages OEE through mostly manual processes with individual operators using a homegrown system to capture data from a variety of legacy platforms and SAP ERP to calculate scores. More recently, its OEE efforts are being burnished by a project to holistically improve asset health across its 70 plants using Emerson condition monitoring technologies. While the detailed asset health data doesn’t directly change OEE calculations, it does provide a guide to target improvements.
“With its asset health information, Cascades can drill down and figure out what needs to be improved in order to have better OEE results,” says Alain Pellegrino, vice president of industrial reliability solutions for Laurentide Controls, an Emerson Impact Partner working as a system integrator on Cascades Canada’s asset health project.
Moving forward, standardization of terms and coding across the disparate mill sites will be a priority to squeeze more value out of OEE and use it as a tool to compare factory performance.
“We have to make sure when we’re comparing one paper mill with another and one has an OEE of 85 and the other an OEE of 84, that the 1% difference is real, not just because they’re doing OEE differently,” Bedard says. “We are working on governance—standard codes and ways of doing assessments to make sure data is compiled in the same way.”
About the Author