Industrial Energy Monitoring Made Simple
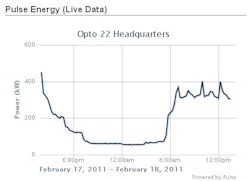
The energy data on this page is from an OptoEMU Sensor at the Opto 22 manufacturing and headquarters building in Temecula, California, U.S.A.
When we analyzed our energy data, we were able to reduce costs almost immediately by turning off lights and equipment when they weren't needed. Since electricity pricing in our area is tiered and based on time-of-use (TOU), we paid close attention to high energy-use equipment like the HVAC system. By improving air handler efficiency and controlling when fans run and when outdoor air is used, we significantly reduced costs, especially in the summer. (Read the Opto 22 Energy Management Case Study for more details.)
Opto 22 - www.opto22.com
