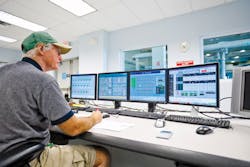
The global process industry loses $20 billion—or 5 percent of annual production—due to unscheduled downtime and poor quality, according to a study by ARC Advisory Group Inc., of Dedham, Mass. ARC estimates that almost 80 percent of these losses are preventable, with 40 percent largely due to operator error. Craig Resnick, ARC research director, believes that much of this waste can be avoided through improved visualization and display tools. “Display and intelligence tools used to be a luxury. Plants could function without them because they had great experience,” says Resnick. “But in the last down cycle, plants had to trim down and there was a brain drain. This creates more need to use displays and video technology to see what’s happening on the factory floor.”New visualization technology is giving plant operators a more accurate view into the operation of the plant. They can now see metrics posted on their dashboards in real time. They can get safety alarms and maintenance notices on their laptops and Blackberries. Plant-data visuals can also be shared outside the plant. Inventory consumption is sent to purchasing managers, and orders filled can appear on screens in the sales office. Chief financial officers can watch plant functions translated into profitability metrics.Yet, not all plant operators welcome snazzy new visuals, video and simulations. To some degree, drawing the line between those who love to watch the digitized version of the plant and those who would rather walk around and listen for a squeaky bearing depends upon the year an operator was born. Those born before 1980 don’t trust the visual images provided to plant operators, and those born after 1980 don’t trust viewing the plant without them.In the past, operators received most of their data in the form of spreadsheets that were printed hours after the operation, if not days after. That’s changing. “Operators are not going to look at a spreadsheet to see what’s going on any longer,” says Dave Strobhar, head of the Center for Operator Performance at Wright State University, in Dayton, Ohio. “They’re going to look at the display and say, ‘Yes, that makes sense,’ or, ‘I need to take some action.’ ”Ultimately, the visual dashboard should be so user-friendly that you’re seeing a simulation of the operation and not just data about the operation. “What we’re trying to do is make the interface disappear so you get the feeling you’re working with the area of concern and not an interface,” says Kevin Bennett, co-director of the Joint Cognitive System Laboratory at Wright State. “In one of our evaluations with the Army, a commander used a visual simulation and said, ‘I can see the decision.’ That happens when you load things into the interface that move the interface to perception and action.”Some believe new display technology doesn’t go as far as it should. While it may alert the operator that things have slipped, it might not give insight into what’s wrong and what needs to be done to correct it. “The recipe is controlling the batch now, and the operator doesn’t know what it’s doing,” says Strobhar. “Plants are seeing skill degradation, and most people are not trying to come up with displays for advanced control systems. I’ve seen dashboards with key process parameters. If things are running well, great. But when things become a little off, the operator doesn’t know what to do.”Have it your wayA wide range of alarms—both for safety and maintenance—have become available on dashboards and a variety of devices. “They want to see if something has gone wrong before it shows up on spreadsheets,” says John Weber, president of Software Toolbox Inc., a provider of automation software components based in Matthews, N.C. “If something goes wrong with a boiler, they want to see it in 15 minutes. It helps if the alarm is in front of them on the dashboard.”Information related to solving an alarm situation can accompany the alarm itself. “When an alarm goes off, you can include a snippet of video that can let first responders know whether to bring a wrench,” says Steve Rubin, president and chief executive officer of Longwatch Inc., a video technology company in Norwood, Mass.Visual data can be sliced and diced depending on the viewer’s discipline. In the past, operators and others concerned with plant operations have complained about data overload. In response, automation vendors have started to filter data so that each discipline only needs to look at data pertaining to their area of concern. The sales staff needs to know about orders filled and not production metrics. The purchasing manager needs to know inventory depleted and orders pending, not maintenance data.“Different people in the company are interested in different types of information,” observes Siddharth Taparia, senior director of business intelligence and analytics in manufacturing for enterprise software supplier SAP Americas, in Newtown Square, Pa. “The supply chain person wants to know how much inventory you have. The plant operators want to know if you have enough inventory for the specific orders they have to fill. Finance wants to know if you’re building products at the right price.” He notes that each person may want to see the data in a different way, whether it’s on a computer screen or a phone.New display data can be broken up and displayed so operators get just what they need and get it how and where they want to see it. “One change in visualization is you can see it anywhere, and it’s very compartmentalized,” says Sujeet Chand, senior vice president and chief technology officer at automation supplier Rockwell Automation Inc., in Milwaukee. “You can have a display mounted on a machine and it shows you information relevant to that machine. Or you can collect data from a server and have it display on someone’s PDA (personal digital assistant).”Generational divideMany of the new visualization tools have been around for a few years, but they haven’t been particularly welcomed by baby-boomer engineers who wanted a less digitized look at the plant. But boomers are starting to retire, and many were laid off during the recession. So visualization tools are helping to fortify less-experienced, younger engineers. Plus, the millennial generation (those born after 1980) is eager to adopt new technology. “Some of the high-tech stuff we wanted to implement in the past didn’t fly with the older generation, but it’s flying with the younger generation,” says Adam Lund, principal usability engineer for automation supplier Emerson Process Management, in Eden Prairie, Minn. “The younger engineers are more tech savvy. They definitely have a greater willingness to adopt technology.”While young engineers may be familiar with video displays, that doesn’t mean they know what to do when things slip. “In many cases, the people coming in are a billion times more literate than the people leaving, but do they really understand what’s going on?” asks Resnick, of ARC Advisory Group. “They’re very comfortable with the technology and the PC (personal computer) end. They like getting their updates on the Blackberry and laptops, but somebody needs to tell them how to do a better job with diagnostics and solving problems.”Some argue that older workers welcome new technology if it gives them what they need. “We’re beginning to see multi-generational appeal,” says Weber of Software Toolbox. “The young person sees and recognizes Microsoft widgets, while the older worker says, ‘Ah, I’m finally getting a KPI on my dashboard.’ You don’t have to be techno to see the value.”“If you use a common platform and a common look and feel across the product line, it benefits training,” says Randy Pearson, manager of machine support at vendor Siemens Industry Inc., Drive Technologies, Motion Control and Machine Tool Business, in Elk Grove Village, Ill. “You can move from one machine to another and you don’t have to learn different ways to do things.”New visualization tools have emerged over the past three or four years, but they are just recently becoming more widely deployed. Displays on dashboards can show data on production, safety, maintenance and asset utilization trimmed down to what the operator needs and only what the operator needs. Different data can be sent to those in other parts of the company, from the chief financial officer to purchasing and sales. Visualization tools are also being used for training and simulation.Related Sidebar - Opening Secret Corners of the PlantTo read the article accompanying this story, go towww.automationworld.com/feature-7144.
Subscribe to Automation World's RSS Feeds for Feature Articles
About the Author
Rob Spiegel
Contributing Editor
Sign up for our eNewsletters
Get the latest news and updates

Leaders relevant to this article:
