Big Data

If they’ve used Big Data to any degree, it’s hard to find a company that doesn’t extoll its virtues for predictive and real-time insights. Industrial Big Data in particular—specifically the large and diversified time-series data emanating from Internet-connected automation equipment from sensors to plant floor machinery—has notable and demonstrable business value for companies looking to distill data into insights that drive better business and plant performance.
As trendy as it may sound, it’s only the name—Big Data—that’s of recent vintage. Companies have been collecting time series data from factory floor and field assets for decades. However, much of this data remains unused, trapped in siloed, proprietary historians and supervisory control and data acquisition (SCADA) systems that often aren’t readily accessible much less available to meld with other relevant business data to drive broad-based actionable insights. And while plant managers and maintenance workers have long analyzed data from specific plant floor assets—mostly with spreadsheets— this was rarely, if ever, done with wide business transformation in mind.
That’s all changed thanks to the scale of what’s possible fueled by technology advances in edge and cloud computing, data acquisition and historian tools, and artificial intelligence (AI) and machine learning (ML) analytics. With these technologies, manufacturers can transform siloed data and proprietary systems into flexible and intelligent factory floor and industrial operations that can be holistically automated and optimized in near-real-time. They are building next-generation systems able to sift through the volume and variety of industrial Big Data to up level operations and optimize performance, including reducing maintenance costs, ensuring near-zero downtime, boosting product quality, and driving additional revenue streams through the introduction of new services.
Orchestrating a successful industrial Big Data analytics program requires investment in a number of central technology components. Critical to the mix are:
Most DAQ systems record, store, and visualize the data in addition to providing some base level analysis and reporting capabilities. More recently, data acquisition systems are being integrated with real-time control applications, pairing the ability to acquire data quickly with the possibility of reacting to events using highly deterministic data. These new capabilities also allow manufacturers to track and measure current performance against historical trends.
Though its function is not that different from a data acquisition system, the difference lies in how they’re designed to collect data. DAQs collect both high- and low-speed data from a variety of sensors, and commonly have a very high-powered computing system either built-in or connected to them. DAQs can also handle signal conditioning—an essential capability for processing sensor data.
While historians can collect direct sensor data like DAQs, they can also collect data from larger systems and equipment; however they tend to do so at a slower rate than a DAQ system. While historians can collect data in real time, their main purpose is to collect data over longer periods of time— days, weeks, or months—rather than for specific, short time periods.
The two basic types of historians used in manufacturing are:
- Time-series databases, where data are logged with time stamps to simplify tracking and monitoring; and
- Operational historians, which combine historian software and time-series databases for fast retrieval of the large amounts of data collected for Industry 4.0 and Internet of Things applications.
Like other data collection technologies, a database is at the core of any CMMS, but it is more than a field data capture tool. The insights it provides help reduce downtime and aid troubleshooting. That’s why CMMS technology is often used for creating reports and identifying key performance indicators.
Edge and cloud computing: As more sensors, PLCs, and other devices are connected to the Industrial Internet of Things (IIoT), there is a requirement to move additional computing power closer to the source where data is generated. Bringing computing capabilities closer to the edge of a network—directly on the shop floor, for example, or at a remote oil rig or wind turbine site—enables efficient processing of real-time data about the condition and performance of the industrial asset without the traditional latency challenges that arise when channeling data to a central network system for monitoring, analysis, and even real-time automation. Edge capabilities also enable IIoT-enabled use cases in instances where high-bandwidth connectivity is not readily available, such as in rural areas or remote plant sites.
Edge capabilities are central to empowering new data-driven use cases such as predictive maintenance or real-time quality management. In these instances, plant floor equipment and industrial assets are continually monitored and analyzed at the edge, empowering corrective actions that could include diagnostic checks, initiating maintenance work orders, even enabling a specific condition based maintenance action.
In most IIoT-enabled industrial Big Data use cases, it’s not a matter of deciding between edge or cloud-based systems to support predictive maintenance or asset optimization applications. Typically, companies turn to a combination of edge and cloud functionality, with the cloud poised to deliver additional storage and compute scalability while providing a way to aggregate data from myriad industrial assets and edge computing systems, or even multiple plant floor operations for analysis.
While operations personnel have had early successes building analytical models, typically in Excel spreadsheets for a single machine in a factory or for a particular use case, they have less experience scaling those efforts to bring intelligence to the entire factory, let alone to operations that span factories across the globe. The unique nature of data collected in historians and SCADA systems is also different than the more familiar enterprise analytics. While enterprise data in financial or customer systems is usually well structured, time-series data lacks context for understanding how the raw data can and should be applied to understand the state of a specific process or the condition of materials on a manufacturing line. Next-generation analytics tools add modeling and machine learning capabilities to uncover patterns, classify and contextualize digital twin of a factory so anomalies can be spotted and downtime issues readily addressed.
Without the technologies that deliver such context, manufacturers will be hard pressed to fully leverage data to drive Industry 4.0 applications such as continuous operational performance improvements, condition monitoring, or predictive or prescriptive maintenance applications.
Analytics software can be used a stand-alone technology, receiving data from a variety of connected devices. It can also be included in edge and cloud computing technologies wherein data collection and analysis are conducted in one system. Many manufacturers employ a hybrid approach using edge and cloud technology for analytics—with edge computing analyzing real-time data for day-to-day operational insights and cloud computing for longer-term analysis for strategic operations and business applications.
While most end user respondents (86%) indicate they collect data from equipment and devices specifically for production improvement initiatives, most have begun doing so only within the past five years. Only 27% of respondents indicate that they have been collecting data for such purposes for more than six years.
In line with these end user results, 71% of responding industrial system integrators report seeing a noticeable increase in interest around data collection and analysis from their clients.
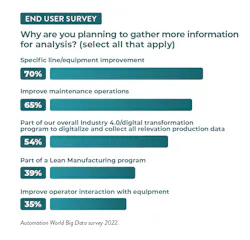
An interesting point among the end user responses is that 98% plan to gather even more data from their production systems in the next two years. However, only 30% plan to do so for specific operational improvements.
This could indicate that, of those who have been collecting and analyzing data for a few years, many may have already discovered numerous ways of improving their production operations and could be looking to leverage the data they collect for other, strategic business purposes.
If you’re among those companies not actively aggregating and analyzing data for production improvement, most of your industry peers are also relatively new at it too. However, with so many businesses actively pursuing this, those companies not already looking to improve production via data analysis are in a small enough minority to be considered laggards in this area. Meaning that it will only become more difficult to compete as your data-analyzing competitors discover ways to improve their production operations before you can do the same.
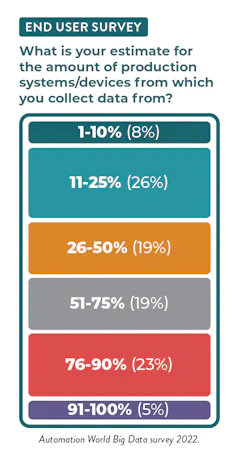
Level of data collection
Looking at the depth of data collection activities
across industry, 53% of end users say that less than
50% of their production systems or related devices
are connected for data collection purposes. In contrast,
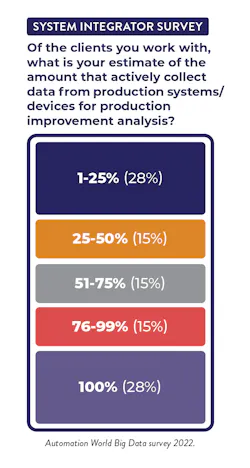
system integrators note that, among their clients,
only 42% collect data from less than 50% of
their production systems or devices.
At the other end of the spectrum, integrator respondents note that 29% of their clients collect data from all of their production systems/devices. This may a bit of overestimation on the part of the integrator respondents, as only 5% of end user respondents report having more than 90% of their systems/devices connected for data collection.
There is also a significant difference among respondents in the middle tier—in which 51%-90% of systems are connected. Just 29% of integrators indicate their clients have 51%-99% of the systems/devices connected, while 42% of end users estimate that 51%-90% of their systems/devices are connected for data collection.
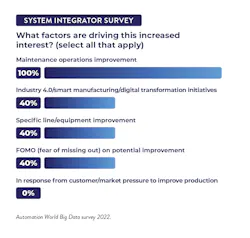
System integrators also cited these applications as the top three reasons they see industrial clients collecting and analyzing data, but the order differs somewhat. Integrators say 100% of their clients’ data collection and analysis is put toward to maintenance operations improvement, while just 40% cite both Industry 4.0/digital transformation initiatives and specific line/equipment improvements.
Another reason cited by 40% of integrators is FOMO (fear of missing out) on potential unidentified improvements. One integrator respondent said the emphasis now being placed on remote operations is making organizations “not want to miss any data points that could lead to erroneous decision making.”
Types of technology used
Talk of digital transformation, Internet of Things,
Industry 4.0, and Smart Manufacturing have dominated
industrial technology discussions for more than
a decade. But the reality is that most manufacturers
rely on data collection and analysis technologies that
existed long before the advance of the technologies
receiving the bulk of attention today.
That’s not to say newer collection and analysis technologies are going unused—as that is certainly not the case. Edge and cloud technologies, for example, are being used widely across industry. Even so, there remains much headroom left for their growth. Only 29% of system integrator clients use hybrid cloud/edge technology and 14% use stand-alone cloud systems.
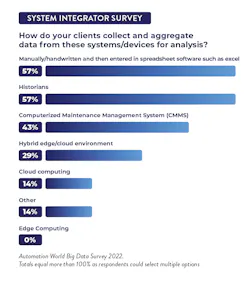
According to our survey results, most manufacturers rely on three methods of data collection and analysis—and only two of them would be considered automation technologies.
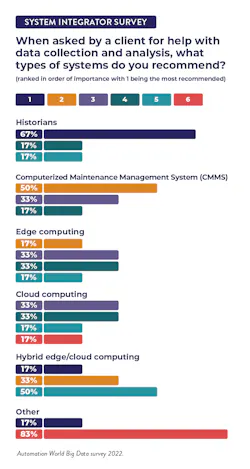
System integrator respondents say that 57% of the clients still rely on handwritten data collection that is then entered into spreadsheet software. The integrators also note that 57% of their clients also use historians, a technology that emerged in 1980. (Editor’s note: respondents were allowed to check multiple categories of data collection types to more accurately reflect the use of multiple technologies in a facility; thus the percentages will exceed 100%).
Clocking in at 43% are computerized maintenance management systems (CMMS), a technology that debuted in the mid-1960s. Integrator respondents also noted the use of data acquisition technologies, another technology that’s been in use since the 1960s.
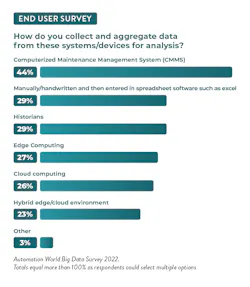
End users responding to our survey still ranked CMMS and handwritten/ spreadsheet as the top two data collection and analysis methods used, though their percentages differed from the integrators. According to end user respondents, 44% use CMMS—largely in line with the 43% reported by integrators. However, end users report only 29% relying on a combination of handwritten and spreadsheet use, which differs dramatically from the integrators’ response of 57%. Though this discrepancy could be attributed to numerous factors, it would be difficult to ignore the possibility that many end users probably prefer not to mention their reliance on handwritten data collection in 2022.
Of note, end user respondents cited broader use of cloud and edge technologies than did integrators. Though no integrators cited use of stand-alone edge technologies in their clients’ facilities, 27% of end users report its use. Also, 26% of end users cite use of stand-alone cloud technologies, compared to the integrators’ response of 14%. End users’ response about use of hybrid edge/cloud technologies is more in line with the integrators’ response—with 23% of end users citing its use compared to the 29% noted by integrators.
Looking more closely at end user responses around cloud and edge technology use, 37% cite use of a hybrid edge/cloud environment for data analysis specifically. In comparison, 32% use edge technology for analytics while 28% use cloud computing.
Key points highlighted by integrators include:
- Start small but ensure the technology you’re using for these small-scale applications can scale across the plant and enterprise.
- Focus on improving the process, not on trying to achieve a specific number.
- Don’t overlook data management and data governance, as data standardization is the key to successful downstream analytics.
- Begin by examining our operations to determine where you should start collecting and analyzing data for meaningful decision-making strategies.
- As you review the technology landscape, carefully assess whether you have the internal resources to support this effectively in-house or if you’ll need outside help.
End users’ recommendations tended to focus more on gathering input from different groups in the workforce:
- Realize that data analysis, on its own, can often be an indirect measure of what is needed to improve operations. Therefore, plan to be inventive around key performance indicator determination and involve process experts as much, if not more so, than data specialists.
- Be sure to include workers directly involved with your production processes. Managers won’t always have the correct point of view to detect areas of opportunity in data.
- Don’t discount your in-house engineering and operating expertise, as they can provide added benefits beyond that delivered by the technology.
About the Author

Beth Stackpole, contributing writer
Contributing Editor, Automation World


Leaders relevant to this article: