Getting to the Heart of Improvement Opportunities with Visualization
In a competitive global marketplace dominated by lean operations, how you make your products is just as important as what you make. Are you getting the most from every operating hour or are you plagued by unplanned downtime? Do all of your shifts produce equally or do you have winners and losers? Are you maximizing overall equipment effectiveness (OEE) or are you running units unnecessarily? Or do you even know? The first step to fixing a problem is finding it.
Visualization software applied to real-time feedback from today’s intelligent components can deliver complete visibility into facility operations for improved process and energy efficiency. The result is a factory that produces better quality items at a faster rate and for a lower cost.
The value of visibility
Performance analysis to determine parameters like speed, throughput and energy consumption frequently begins and ends with machine commissioning. The problem is that machine and facility condition change over time as the equipment ages, products and staff change and environmental conditions take their toll. To optimize process and energy efficiency, you need to move to continuous commissioning, in which optimization takes place on an ongoing basis. In order to be practical, however, it needs to be easy, accurate and require minimal time and attention from staff. You’re in business to deliver products to your customers, not to obsess over the details of instrumentation and algorithms.
The process begins with gathering data from your equipment using a data logger. This should encompass not just production lines but facilities and building automation equipment like fans and blowers, compressors and so on. Data capture needs to be comprehensive in order to create a full picture of your operation.
Acquisition also needs to be strategic, gathered for a specific objective such as energy management, machine-health monitoring, productivity analysis, etc. Monitoring a device just because you can is not just unhelpful, it’s counterproductive because all of that data clogs up your network and fills up available storage.
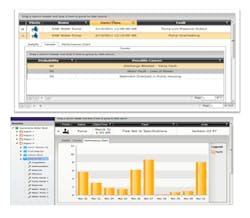
Even the right data set by itself is not enough. It needs to be converted into actionable information, preferably automatically and in real time in order to truly improve operational efficiency. This is where analysis tools come in. Visualization software can enable you to uncover unnecessary steps, weed out inconsistencies in product quality, and develop a predictive maintenance program (see figure 1). Each of these provides an opportunity for improving production and lowering cost of operations.
The visualization software will be based on a set of rules that allow the software to analyze input and flag anomalies. Rules should include parameters and thresholds, as well as associated price calculations that will allow you to prioritize predictive maintenance based on cost effectiveness. To minimize your time investment, the software should include a library of predefined fault rules that can be customized to meet your specific needs.
Another important functionality is fault-state tracking, which provides insight into the lifecycle of faults. In this case, the software should use your fault rules to identify when a fault incident becomes active, track the resolution and monitor when it returns to an inactive state. Commissioning and maintenance personnel should have the ability to save comments on the event. This establishes a history that can be used to predict the likelihood of recurrence, advise of the cost involved and simplify the identification of root causes for faults considered problematic enough to address.
Harvesting the low hanging fruit
The low hanging fruit you can harvest just by performing a plant audit with your data logger and software can yield big savings. One organization that was considering the purchase of a new machine because they were unable to meet production targets discovered that their line rate on the existing machine had slowed to only three quarters of design spec. Another found out that compressors in one part of the plant were being left running overnight when operations should have been closed down. Even a few-horsepower motor running continuously can squander thousands of dollars in a year, justifying the effort involved right there.
Manufacturing and facilities exist in a perpetual state of change, whether that involves modifying operating time or speed, expanding facilities, upgrading, retiring or adding new production lines, etc. In a dynamic environment, particularly one with hundreds of thousands of square feet of production space, low-hanging fruit will grow again. Having visibility into your factory will allow you to harvest it before the negative effects become catastrophic. Learn more about the process and technology here.
Meet the tools: AX Facility
Mitsubishi Electric’s AX Facility provides an easy-to-use application to convert data into actionable insights. The visualization software is based around real-time fault detection and diagnostics (FDD) algorithms that monitor equipment performance and operation and convert it into easily consumable output. AX Facility calculates the probability of fault occurrence and the associated cost, making it easy to predict downtime and prioritize the correction of faults based on available resources. The application includes a library of more than 300 preconfigured fault rules for common manufacturing and facilities automation equipment. Customization options allow users to modify these rules for their particular operation to get up and running quickly.
Fault-state tracking provides traceability so that maintenance and managers can easily access the frequency, duration and resolution of faults. Automated fault detection delivers real-time notifications to even remote locations and the FDD Viewer option presents list of probable causes. AX Facility has been shown to reduce service costs by 50% and energy costs by 6% or more. Users typically see return on investment in 12 to 18 months.
Further Reading
http://www.mitsubishielectric.com/believe/e-factory/
http://dl.mitsubishielectric.com/dl/fa/document/catalog/sol/efactory/l16023/l16023eng-a.pdf

