Dashboards Drive Better Decisions Throughout the Plant
With the range of advanced manufacturing systems available on the market, the plant-floor is awash in information. Harnessing that data—organizing it and making it usable—is what yields meaningful performance gains, and that’s a nut that for some has been hard to crack.
For example, if a valve fails on a production line, the operator often knows it immediately—he can see or hear the failure, fix the problem as quickly as possible and resume production. When it happens again under similar circumstances, however, maintenance is none the wiser. Later in the day, management won’t know why that line failed to meet goal and thus won’t ever be able to accurately estimate capacity.
Instead, consider the impact that could be made on operations by making that valve failure visible plant-wide. Maintenance could plan repairs based on predicted uptime/downtime cycles; management could adjust production and profitability assumptions.
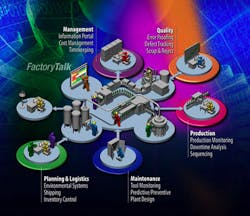
To achieve that level of collaboration, manufacturers need a simple and graphical way to make information both visible and actionable throughout the enterprise. But such collaboration is only possible with the visibility provided by role-appropriate dashboards. When those dashboards are fed by relevant, timely Manufacturing Intelligence, the result is superior decision-making at every level of an organization.
Software tools, like FactoryTalk VantagePoint, contextualize information from data silos throughout the plant and format it into easy-to-read, fully-customizable dashboards, enabling manufacturers to achieve continuous improvement goals.
When each role-player in the plant has a more complete view of the plant, each can make more informed decisions to positively affect production and profit. For example, when an operator experiences a downtime incident, his dashboard shows him where the exception occurred. Viewing the operator dashboard, the operator sees that Filler 1 is offline; a few additional dashboard clicks enables him to dig deeper for more data on machine performance, such as how much overall downtime has occurred during the past several shifts, or to hone in on a specific time stamp to perform root cause analysis.
Providing others in the operation access to those data points expands decision-making. As shown in the “Maintenance Manager” image, the same downtime data visible to the operator is available on the maintenance dashboard. Maintenance can see that a machine is offline, and click through to see the root cause of the downtime. The trending information available on his dashboard further clarifies that problems appear to be occurring primarily on one shift, enabling him to make immediate decisions on a specific machine-failure to more quickly solve the issue, or to adjust maintenance intervals to reduce or eliminate breakdowns altogether.
If maintenance decides to take down a line for servicing, his dashboard can also show him other issues that line might be experiencing so that he can handle them at the same time. His dashboard can also show output on other lines, helping him to determine the best time to service the problem line and shift production to the others.
Further, the plant manager can view the same information on his dashboard in real time (see “Plant Manager” image), reducing the time either the operator or maintenance personnel need to spend summarizing in formal reports the data, trends, or action taken. In addition to that detailed machine-level information, the plant manager’s dashboard can provide detailed information about OEE or other key performance indicators over multiple shifts.
The critical capability is to enable users to view the information that is relevant to their role and be able to use it regardless of the system from which that information was derived.
That’s just what FactoryTalk VantagePoint allows users to do. Through a Unified Production Model, FactoryTalk VantagePoint can pull information from control systems, sensors, historians, and business systems, contextualize it, and present it effectively in customized dashboards. That customization provides users data at whatever level of detail they require—whether that’s a simple green-means-go-red-means-stop alert, an aggregated snapshot of performance indicators, or whether they need to drill down deeper into a particular detail. The key element is that each is based on the user’s role and scope of decision-making authority. Thus, VantagePoint’s dashboarding capabilities truly put the user in control--of both the information and his own time.
Returning to the filler example above, a plant manager can use VantagePoint to drill down through each screen of his dashboard to get the level and detail of information needed to improve his understanding of all the factors that contribute to profitability: capacity, scrap, materials costs, etc. Most importantly, he can make decisions based on a complete picture of the plant—all from his desktop. That is Manufacturing Intelligence at work.
For more information, visit Manufacturing Intelligence.

