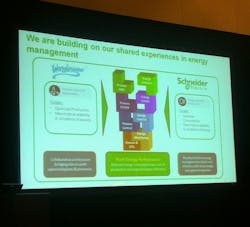
Whether the mandate is to reduce the electric utility bill by 10 percent or to create and sustain a culture of energy conservation, engineers tasked with managing energy at the corporate level need two things: data and help. Both can take many forms. In their presentation at the 2014 Software Global Customer Conference, representatives of Schneider Electric discussed the tools and tactics they recommend.
Mike Munro is in strategic marketing for the Schneider Electric. Christian-Marc Pouyez is the product manager for the company’s Wonderware Intelligence and Corporate Energy Management software offerings. Together, the two men presented use case examples of companies walking the path of industrial energy management.
“The energy management journey is not the same for everyone,” said Munro. “There are stages that range from basic awareness to improvement to performance, and where you and your company are on the path determines what tools you might need.”
Given a corporate mandate to reduce energy by 10 percent, an engineer might do the obvious, quick-payback things like turning off unused lighting or dialing back boiler operations. Energy data is probably scattered and incomplete, without even a baseline besides the monthly utility bill.
“The way a lot of people start is looking at the utility bill,” said Munro. “But if you don’t have detailed information, you don’t know how to save money. You need to identify and prioritize energy types—water, air, gas, electricity, steam—and identify key internal stakeholders.”
Munro said metering is the foundation for getting data below the utility-bill level of granularity, and much equipment has existing metering built in—it just needs to be discovered and connected. “And you don’t need to meter everything upfront, just on main incomer and in a few key places around the plant,” he said.
For doing cost analysis on the electrical side especially, you want time-interval logging aligned with the utility, he added.
Those who have been monitoring energy consumption for a while are farther along the path, said Pouyez, and they should look at reducing “energy intensity,” which is energy use per product output. These folks have lots of good data, but also good days and bad days in terms of cost reduction. This is the stage for identifying opportunities for systematic improvements and defining realistic targets.
“Start capturing additional data, such as downtime events, alarms, how much production, batch start/stop, and other context like product type, order number or shift. All that allows you to calculate energy use per unit of product. Now you can better predict how much energy is going to be used.”
Companies also need real-time dashboards, HMIs for operators and daily reports to make sure they are accomplishing what you should, he added.
Users at the “energy performance” stage often seek energy management tools to solve production problems. Pouyez cited the example of a consumer packaged goods company that was having unexplained production-line outages. Variable frequency drives were mysteriously going out, requiring a restart process that took 3 to 8 hours at a cost of $20,000 per hour. Engineers guessed it was a problem with harmonics, so they brought in Schneider Electric for an assessment.
Smart metering can capture elusive power events and feed into analysis. Schneider Electric installed an Advanced PQ meter on the main incomer, and 25 meters on key equipment around the plant. Engineers discovered that although the problem was harmonics, it wasn’t coming from any of their equipment. It was actually coming from a heavy equipment operator outside their plant
“The proof captured by the system provided leverage to compel a response from the utility operator,” said Pouyez.
The same system also collected baseline data on energy usage that allowed the facility to allocate costs back to individual production units. “What customers find is that addressing some of these issues ties into energy management in the conservation sense,” added Pouyez. “Where there are harmonics, for example, there is inefficient use of energy.”
The company’s Wonderware CEM 2014 R2 software should be available before the end of the year. It will include full support for application server redundancy, a new demand attribute in the meter object, easier installation and configuration, and greater robustness, said Pouyez.
As for next steps for the plant energy performance solutions, Pouyez and Munro said their groups are “in the research phase for combining our tools and services, and we need input from our customers to help us drive more value and technical feasibility for them.”
About the Author
Renee Bassett
Managing Editor

Leaders relevant to this article:
