Watch list
Testing, commissioning and diagnostics are activities familiar to every automation technician. Efficient work is only possible if the elementary process variables can be monitored. The SolutionCenter provides users of the M1 automation system with all the tools needed for this. In version 1.95 a freely configurable variable list was integrated for process analysis, as well as a watch list with a wide range of useful functions.
The monitoring of process variables is a way of testing the behavior of automation systems. For the user here the controller is a black box: Defined signals are fed to the inputs and their trace observed at the outputs. If it is possible to read and write variables selectively, this enables conclusions to be drawn about the behavior of the automation system. For efficient work, however, a randomly sorted list of all controller inputs and outputs, as offered by most manufacturers, is not enough. That is why Bachmann offers a freely configurable variable list in the SolutionCenter – a so-called watch list.
The user defines the content
The variable list can be configured quickly by the user – by selecting the variables or channels with drag & drop or in the dialog window. The number of variables that can be entered is unlimited. Extensive filter and sort functions are also provided that simplify the handling of extensive lists. The user can furthermore manually place the most important variables at the beginning of the list. Variables and channels of different controller systems can be managed in just a single list. In this way, overlapping processes in large machines and plants can be observed and followed. The cycle time for fetching the actual values can be set between 200 milliseconds and 2 seconds.
Integrated setpoint definition
Setpoints for individual parameters can be defined very easily with the help of the watch list. These values can be defined with multi-selection in a separate column and downloaded to the controller with just one command. Conversely, actual values from the controller can be entered directly as setpoints in the list.
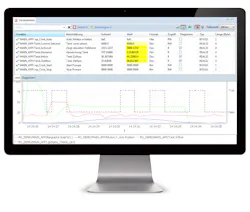
Clear trend display
The SolutionCenter shows all the selected variables in a trend graph. This makes it possible to trace signals over time. Extensive configurations become unnecessary: The graph axes and the curves plotted are set up and configured automatically to produce an informative display.
The new variable list in the Bachmann SolutionCenter provides optimum support for important testing and diagnostic tasks with automation applications. Maximum efficiency is thus guaranteed.
>> For more information, click here
