The latest release of PlantTriage includes Visual Performance Mapping, which shows the performance of thousands of assets on one browser screen, says the vendor.
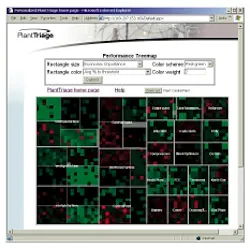
Visual Performance Mapping allows management, engineering and maintenance to determine with a glance how a plant is performing, and where effort is needed for improvement. By drilling down into an asset, users can view complete diagnosis of problems. They can zoom in on specific plants within the site and specific unit operations within a plant, then further drill down into specific loops for detailed diagnosis. Each asset is represented by both size and color of a rectangle. The larger the size, the more important the asset. The brighter the color, the more opportunity there is to make improvements.
Optimize food production with SEW-EURODRIVE’s hygienic, energy-efficient automation and drive solutions for precision, reliability, and sustainability.
George Reed, with the help of Factory Technologies, was looking to further automate the processes at its quarries and make Ignition an organization-wide standard.
Goodnight Midstream chose Ignition because it could fulfill several requirements: data mining and business intelligence work on the system backend; powerful Linux-based edge deployments...
In the automation world, the Purdue Model (also known as the Purdue reference model, Purdue network model, ISA 95, or the Automation Pyramid) is a well-known architectural framework...