How Data Analytics Can Help Identify Energy Efficiency Issues
Whether your company’s sustainability goals are being set solely to reduce costs or as part of a larger ESG (environmental, social, governance) program, there no escaping the need for data analytics to help achieve these goals. This applies even if you’re only focusing on basic energy efficiency improvements, which is a great place to start considering that nearly 20% of total emissions savings come from energy efficiency improvements.
To illustrate how data analytics can make the most out of your energy efficiency efforts, Wouter Daniels and Luis Miguel Carretero García of TrendMiner, a supplier of data analytics technology, offer an example of verifying the efficiency of a retrofit.
In this example, engineers are looking to determine the effectiveness of adding an integrated solar field to an existing combined cycle power plant. These combined cycle power plants are typically a group of two or more heat engines working together to convert one source of heat into energy for use by the plant. In the example provided by Daniels and Garcia, the power plant used separate gas and steam turbines.
A review of the plant’s key performance indicators showed that plant production had decreased. This led the engineers to determine if the drop was in any way connected to integration issues between the solar plant and legacy combined cycle power plant.
Daniels said, “The first step was to load the data that shows power production and consumption over a specified timeframe. Engineers could use that information to search for periods that demonstrated process behavior both before and after the retrofitting.”
Uncovering sources of energy loss
A comparison table in the TrendMiner software displayed production value information on the solar plant, indicating that fuel consumption had decreased during the past year while power production increased.
Though this was the sought-after result of integrating the solar field with the combined cycle plant, it did not help explain the loss in production.
With this issue determined, the software was used to review the then-current steam production, which showed a fluctuating trend line resulting from the addition of the solar field. Such oscillations are “the result of the irregular patterns of renewable energy,” noted Garcia. “Engineers can use a daily production average for this value instead to run a smoother analysis.”
Formulas were then added to system tags to help the engineers spot points when the steam turbine power fell below its normal value. To compare this current data with historical data prior to the addition of the solar field, engineers used the cross-correlations function of the software to suggest root causes. This showed the engineers that:
- When blowdown decreased, outlet turbine pressure increased;
- There was a two-day window from when the blowdown started falling and before the turbine pressure increased; and
- Once the turbine pressure started to rise, process experts had three weeks until the process shut down completely. Daniels noted that this was the result of calcium deposits inside the heat recovery steam generator pipes, which reduced the vapor production as well as the heat transfer performance.
Determining causation
Though this review of data showed the root cause of the power loss, the engineers could not tell how often the blowdown dropped to the point where it caused this outcome.
“They discovered the cause-effect relationship was unique to this behavior anomaly,” said Daniels. “Therefore, they saved the information as contextual data so that engineers who encounter a similar problem can share the solution.”
“They found that in one corner of the solar field, the panels were reaching 675 degrees Kelvin,” said Garcia. “Using that temperature, they were able to find similar periods where the temperature was that high or more.”
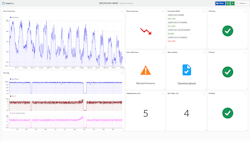
Engineers used a Gantt chart to show the relevant process events by asset—with extremely hot temperatures displayed separately from normal operations.
Daniels said, “This created an overview of plant performance. Now, when the solar field reaches temperatures outside the normal zone, an alert notifies process experts to resolve the problem.”
About the Author
David Greenfield, editor in chief
Editor in Chief

Leaders relevant to this article:


